Excel Linear interpolation function within 1‑dimensional table
Linear interpolation within a 1-dimensional table can be done with regular MS Excel functions. But it will become a pretty long formula, that is hard to read and/or copy across. You can also implement a user defined function (UDF, built with VBA code) interpolateX. The VBA code of this function is found at the end of this page.
This function works both for ascending and descending header data, and both for horizontally or vertically organized data.
The LAMBDA equivalent L_InterpolateX is found below as well. LAMBDA functionality exists since Office365/Excel 2021. LAMBDA functions are user defined functions created directly within Excel's Name Manager, without VBA code. They execute faster than a VBA based UDF.
If you want to create a curve that goes exactly through all your data points in order to interpolate, then see splines interpolation.
If you want to interpolate both X and Y values within a 2-dimensional table, then see Bilinear interpolation (linear plus spline based).
Calculation explanation of above example
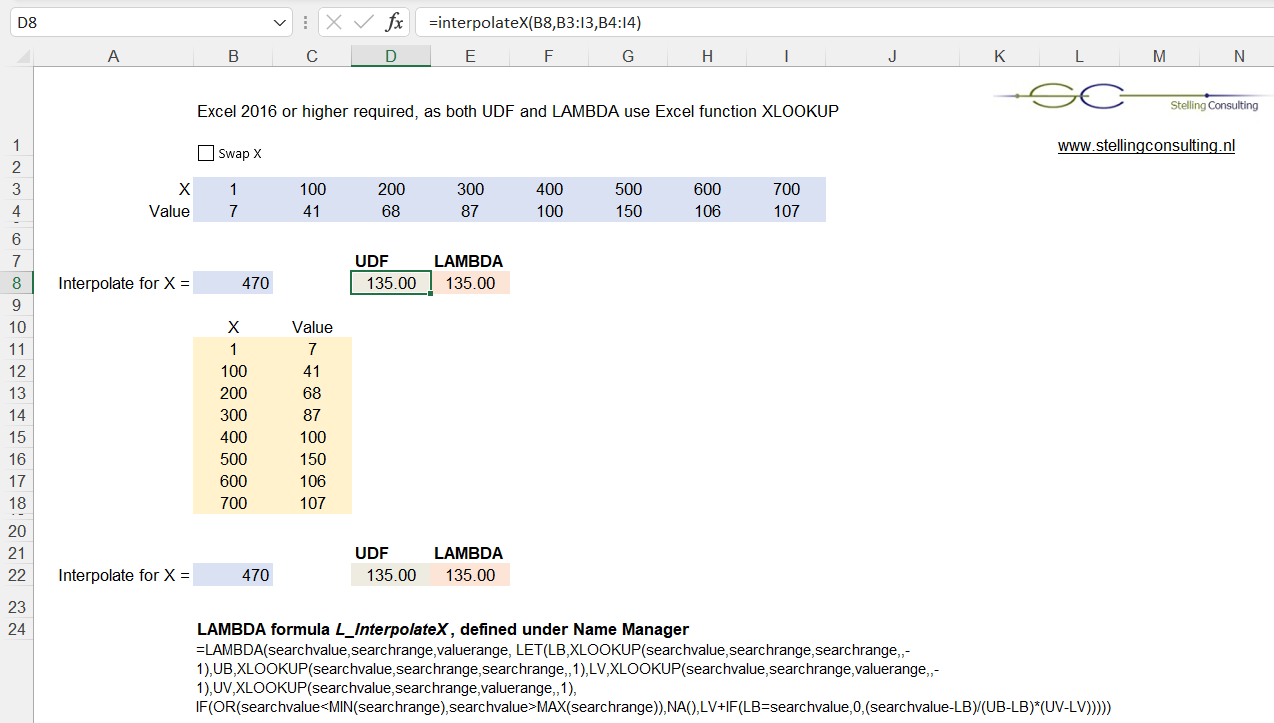
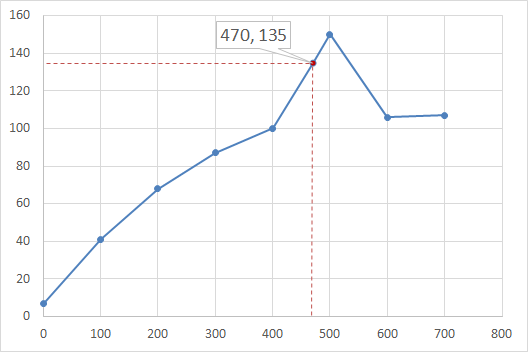
Visualisation of data table
Calculation
X = 470 lies between X = 400 and X = 500. X-fraction = (470 - 400)/(500 - 400) = 0.70
The 2 data point values to interpolate between are:
1. (400) = 100
2. (500) = 150
Interpolation:
100 + 0.70 × (150 - 100) = 135.00 which is the final result.
VBA code to be put in a module
In MS Excel, press Alt+F11 to open the Visual Basic Editor (Windows). Via top menu: Insert → Module. Copy the code below into the module.
LAMBDA function L_InterpolateX to be put in Name Manager
Dependent on your Excel setting you need to use semicolon or comma in formulas. Best is to open the demo file and copy the formula from there, as it will contain your local settings. Else - if required - copy in function in text editor and replace comma by semicolon before copying into Excel.