Data source
| Copy-paste Batch Geocoder results file generated by Batch Geocoder into text area |
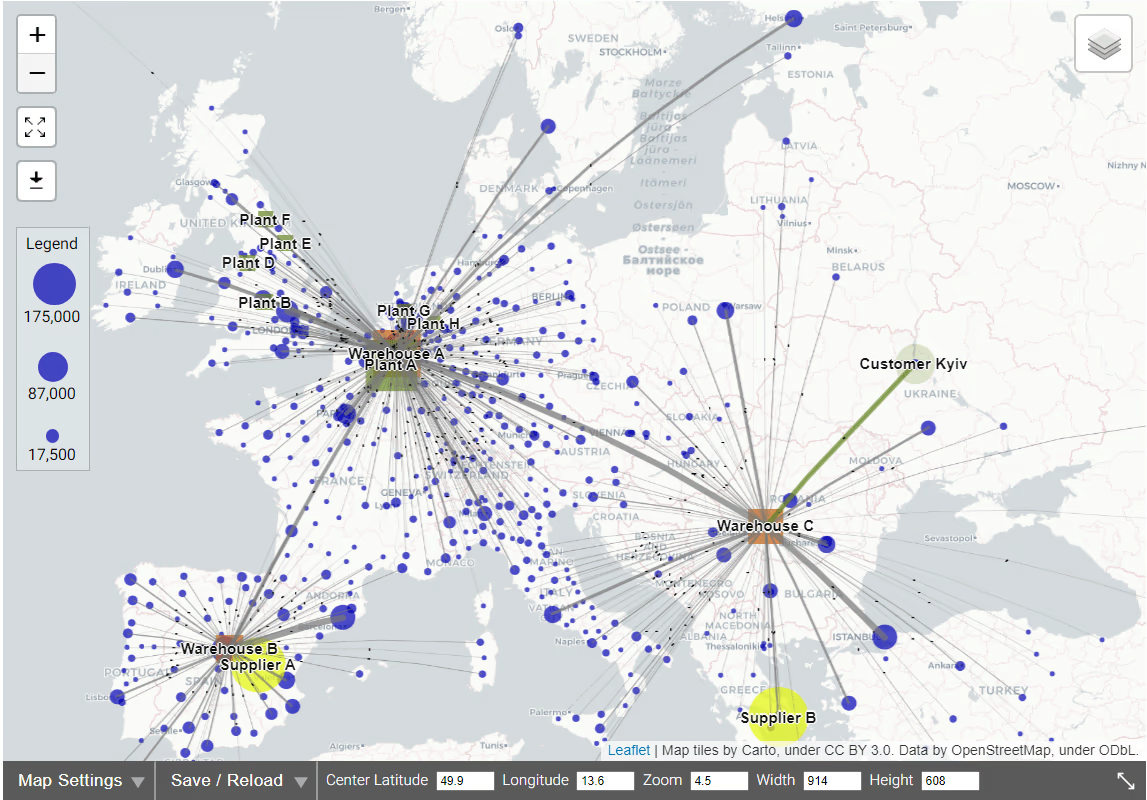
Under Map settings you can adjust:
- circle sizes - via location radius scale factor
- colors - ROOFTOP locations via location type S, all others via location type C
| Latitude | Longitude | Size | Type (opt) | Label (opt) | Color (opt) | Opacity (opt) |
|---|---|---|---|---|---|---|
| From_Latitude | From_Longitude | To_Latitude | To_Longitude | Quantity | Color (opt) |
|---|---|---|---|---|---|
Data import
Enter fields semicolon or tab separated (copy from Excel file, or import template).Download Excel template
Decimal commas are automatically converted to decimal points, and thousands separators removed.
- Latitude, Longitude is the result of converting a textual address into geographic coordinates,
a process called geocoding. You can use:- Batch Geocoder - Free
- Batch Geocoder - Paid
- Excel interfaces with Google Maps / TomTom / BING geocoding api
- Or use any other geocoder of your own choice.
- Size (locations) and Quantity (flows) are numeric values.
- Type (optional) can be set to C, W, P, or S (Customer, Warehouse, Plant, or Supplier).
If not specified, then C is used as default type. - Each location type has its own shape and color.
Generic C/W/P/S colors can be adjusted via Map Settings (found directly below the map). - Color (optional) contains a color code (see color picker below)
If this field is specified, then it overrides the generic C/W/P/S colors.Pick color → Color = - Label (optional) is free format text that is displayed as label on the map.
- Opacity (optional) is a numeric value between 0.00 (fully transparent) and 1.00 (fully opaque).
If specified, then it overrides the generic Location opacity value as set via Map Settings.